Application of combined detection of red blood cell distribution width, ratio of C-reactive protein to albumin and albumin-to-creatinine ratio in predicting complications of type 2 diabetes
-
摘要:目的
探讨红细胞分布宽度(RDW)、C反应蛋白与白蛋白比值(CAR)、尿白蛋白与肌酐比值(UACR)联合检测在2型糖尿病(T2DM)并发症预测中的应用价值。
方法选取T2DM并发症患者与T2DM无并发症患者各104例作为研究对象, 分别纳入观察组与对照组。收集2组病历资料,比较2组一般资料、RDW、CAR、UACR水平差异,并通过受试者工作特征(ROC)曲线分析RDW、CAR、UACR单用与3者联合应用对T2DM并发症的预测效能。
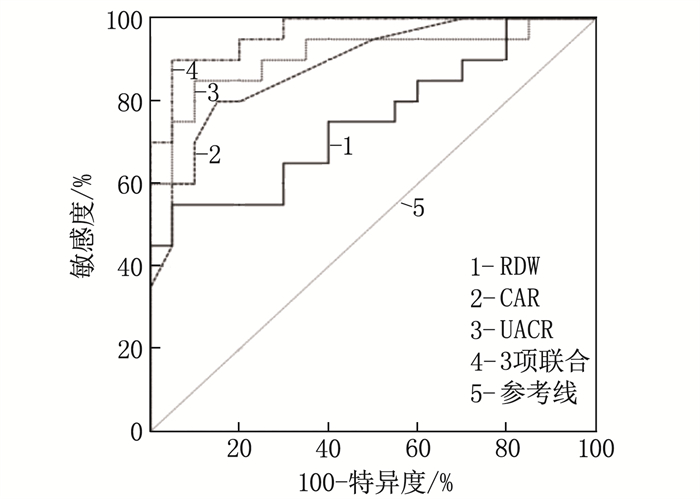
结果与对照组比较,观察组的餐后2 h血糖(2 hPG)、糖化血红蛋白(HbAlc)、总胆固醇(TC)、甘油三酯(TG)、低密度脂蛋白胆固醇(LDL-C)、RDW、CAR、UACR水平更高,高密度脂蛋白胆固醇(HDL-C)水平更低,差异有统计学意义(P < 0.05)。相关性分析结果显示, RDW与2 hPG、HbAlc、TC、LDL-C均呈正相关,与HDL-C呈负相关; CAR与2 hPG、HbAlc、TC、LDL-C均呈正相关,与HDL-C呈负相关; UACR与2 hPG、HbAlc、TC、LDL-C均呈正相关,与HDL-C呈负相关。Logistic回归分析显示, RDW、CAR、UACR均是T2DM患者并发糖尿病视网膜病变(DR)、糖尿病肾脏疾病(DKD)、糖尿病周围神经病变(DPN)、冠心病(CAD)的影响因素(P < 0.05)。ROC曲线分析显示, RDW、CAR、UACR单独检测及3项联合应用预测T2DM并发症的AUC分别为0.753、0.858、0.885、0.915。与RDW、CAR、UACR单独检测比较, 3项联合应用对T2DM并发症的预测效能更高(Z=3.221、2.605、2.334,P < 0.05)。
结论RDW、CAR、UACR水平升高与T2DM患者并发症的发生密切相关,RDW、CAR、UACR单独应用对T2DM并发症均有一定预测价值,但3项联合应用对T2DM并发症的预测效能更高。
-
关键词:
- 2型糖尿病 /
- 红细胞分布宽度 /
- C反应蛋白与白蛋白的比值 /
- 尿白蛋白与肌酐的比值 /
- 并发症
Abstract:ObjectiveTo explore the value of combined detection of red blood cell distribution width (RDW), C-reactive protein-to-albumin ratio (CAR) and albumin-to-creatinine ratio (UACR) in the prediction of complications of type 2 diabetes mellitus (T2DM).
MethodsA total of 104 T2DM patients with complications and 104 T2DM patients without complications were selected as study subjects, and were included in observation group and control group respectively. The differences in general data, RDW, CAR and UACR levels between the two groups were compared. The predictive efficacy of RDW, CAR and UACR alone or their combination for T2DM complications was analyzed by receiver operating characteristic (ROC) curve.
ResultsCompared with the control group, the levels of 2-hour postprandial blood glucose(2 hPG), glycosylated hemoglobin(HbAlc), total cholesterol (TC), triglyceride (TG), low-density lipoprotein cholesterol (LDL-C), RDW, CAR and UACR in the observation group were higher, and the level of HDL-C was lower (P < 0.05). Correlation analysis showed that RDW was positively correlated with 2 hPG, HbAlc, TC, LDL-C, and negatively correlated with HDL-C; CAR was positively correlated with 2 hPG, HbAlc, TC, LDL-C and negatively correlated with HDL-C; UACR was positively correlated with PPG, HbAlc, TC, LDL-C and negatively correlated with HDL-C. Logistic regression analysis showed that RDW, CAR and UACR were the influencing factors of T2DM patients complicated with diabetic retinopathy (DR), diabetic kidney disease (DKD), diabetic peripheral neuropathy (DPN), coronary artery disease (CAD) (P < 0.05). ROC curve analysis showed that the area under curve (AUC) of RDW, CAR and UACR alone and their combination were 0.753, 0.858, 0.885 and 0.915, respectively. Compared with RDW, CAR and UACR alone, the combination of the three indicators had higher predictive efficacy for T2DM complications (Z=3.221, 2.605 and 2.334, P < 0.05).
ConclusionThe increased levels of RDW, CAR and UACR are closely related to the occurrence of complications in patients with T2DM. Detection of RDW, CAR or UACR alone has a certain predictive value for the complications of T2DM, but their combination has a higher predictive efficacy.
-
2型糖尿病(T2DM)是临床常见的一种由胰岛素缺乏或胰岛素抵抗造成的碳水化合物、蛋白质及脂肪代谢紊乱性疾病。机体长期处于高血糖状态可导致慢性代谢并发症,引起多器官、系统功能障碍,如眼部、血管、心脏、肾脏、神经等组织结构及功能异常[1]。近年来,T2DM的临床发病率逐年升高,而糖尿病相关并发症的发生是导致患者残疾、死亡的主要原因,因此尽早预测T2DM患者的并发症发生风险,对改善患者预后具有重大意义[2]。红细胞分布宽度(RDW)是反映红细胞体积变异性的指标,近年来常被用于多种心脑血管疾病严重程度及预后的评估[3]。C反应蛋白(CRP)是临床常用的炎症标志物,白蛋白(ALB)则是评估机体营养状况、急慢性消耗状态的常用生化指标。研究[4]认为,白蛋白、CRP、CRP与白蛋白比值(CAR)对机体炎症状态的敏感度、准确度更高。尿微量白蛋白(mALB)与尿肌酐(UCr)的比值(UACR)对运动、尿量等影响因素进行校正,能够真实反映内皮功能障碍,在糖尿病肾病发生风险预测中的应用较多,但在糖尿病冠状动脉病变及神经病变预测中的价值尚未阐明[5]。本研究旨在明确RDW、CAR、UACR在T2DM并发症预测中的应用价值,从而为临床进行糖尿病并发症防治提供借鉴。
1. 资料与方法
1.1 一般资料
选取104例T2DM并发症患者与104例T2DM无并发症患者作为研究对象,所有患者均符合《中国老年2型糖尿病防治临床指南(2022年版)》[6]中的T2DM诊断标准。T2DM并发症患者纳入观察组, T2DM无并发症患者为对照组。T2DM并发症诊断标准参考《中国2型糖尿病防治指南(十二):糖尿病慢性并发症》[7],并根据肌电图、眼底检查、生化检查结果与相关科室(眼科、神经科、肾脏科、心内科等)会诊确定。同时排除合并其他代谢性疾病、活动性感染、自身免疫性疾病、血液系统疾病、营养不良、恶性肿瘤、终末期肝肾疾病者。所有研究对象均自愿参与本研究,并签署知情同意书。本研究通过了医院伦理委员会审核批准。观察组男47例,女57例,年龄39~80岁,平均(58.25±9.76)岁,平均体质量指数(BMI)为(26.02±5.17) kg/m2,吸烟史47例, T2DM并发症包括糖尿病视网膜病变(DR)22例,糖尿病肾脏疾病(DKD) 88例,糖尿病周围神经病变(DPN)46例,冠心病(CAD)12例; 对照组男52例,女52例,年龄45~78岁,平均(57.23±8.62)岁, BMI(25.84±6.33) kg/m2, 吸烟史42例。2组患者性别、年龄、BMI及吸烟史比较,差异均无统计学意义(P>0.05)。
1.2 方法
采集患者的空腹静脉血3 mL, 离心10 min(转速3 000转/min),保留血清待检。使用贝克库曼尔特公司生产的AU5800型全自动生化分析仪测定空腹血糖(FPG)、餐后2 h血糖(2 hPG)、糖化血红蛋白(HbAlc)、RDW、血肌酐(SCr)、白细胞(WBC)、总胆固醇(TC)、甘油三酯(TG)、低密度脂蛋白胆固醇(LDL-C)、高密度脂蛋白胆固醇(HDL-C)、CRP、ALB,并计算CAR, 检测方法均为免疫比浊法。采集晨尿标本5~10 mL, 2 h内使用Advia 1800全自动生化分析仪测定mALB、UCr水平,mALB检测采用免疫比浊法,尿肌酐检测采用氧化酶法,并计算UACR。
1.3 统计学方法
采用SPSS 23.0软件对数据进行统计学处理,计数资料以[n(%)]表示,数据比较采用χ2检验,符合正态分布的计量资料以均数±标准差表示,数据比较采用t检验,指标关系行Spearman相关分析,影响因素采用Logistic回归分析,绘制受试者工作特征(ROC)曲线分析RDW、CAR、UACR对T2DM各种并发症的预测效能,曲线下面积(AUC)的比较采用Z检验, P < 0.05为差异有统计学意义。
2. 结果
2.1 2组患者生化指标水平比较
观察组与对照组的FPG、WBC水平比较,差异无统计学意义(P>0.05)。与对照组比较,观察组2 hPG、HbAlc、TC、TG、LDL-C、RDW、CAR、UACR水平更高, HDL-C水平更低,差异有统计学意义(P < 0.05), 见表 1。
表 1 2组患者生化指标水平比较(x±s)指标 观察组(n=104) 对照组(n=104) FPG/(mmol/L) 7.20±1.27 7.16±2.03 2 hPG/(mmol/L) 12.41±1.70* 11.32±1.70 HbAlc/% 9.14±1.97* 7.43±0.29 总胆固醇/(mmol/L) 4.22±0.90* 3.67±0.84 甘油三酯/(mmol/L) 1.46±0.33* 1.28±0.35 HDL-C/(mmol/L) 1.25±0.50* 1.39±0.32 LDL-C/(mmol/L) 3.50±0.67* 3.12±0.54 WBC/(×109/L) 6.80±2.25 6.77±1.99 RDW/% 14.62±2.05* 12.51±2.37 CAR 0.19±0.08* 0.08±0.01 UACR 31.74±6.49* 14.42±1.33 FPG: 空腹血糖; WBC: 白细胞; 2 hPG: 餐后2 h血糖;
HbAlc: 糖化血红蛋白; LDL-C: 低密度脂蛋白胆固醇;
RDW: 红细胞分布宽度; CAR: C反应蛋白与白蛋白比值;
UACR: 尿微量白蛋白与尿肌酐比值;
HDL-C: 高密度脂蛋白胆固醇。
与对照组比较, * P < 0.05。2.2 RDW、CAR、UACR与血糖、血脂等指标的相关性
相关性分析显示, RDW与2 hPG、HbAlc、TC、LDL-C均呈正相关,与HDL-C呈负相关(P < 0.05), 与FPG、TG无相关性(P>0.05); CAR与2 hPG、HbAlc、TC、LDL-C均呈正相关,与HDL-C呈负相关(P < 0.05), 与FPG、TG均无相关性(P>0.05); UACR与2 hPG、HbAlc、TC、LDL-C均呈正相关,与HDL-C呈负相关(P < 0.05), 与FPG、TG均无相关性(P>0.05), 见表 2。
表 2 RDW、CAR、UACR与血糖、血脂等指标的相关性指标 FPG 2 hPG HbAlc TC TG HDL-C LDL-C RDW r=0.062 r=0.210 r=0.287 r=0.209 r=0.052 r=-0.092 r=0.101 P=0.061 P < 0.001 P < 0.001 P < 0.001 P=0.059 P=0.034 P=0.020 CAR r=0.072 r=0.209 r=0.301 r=0.198 r=0.072 r=-0.101 r=0.097 P=0.068 P < 0.001 P < 0.001 P < 0.001 P=0.077 P=0.020 P=0.030 UACR r=0.091 r=0.224 r=0.029 r=0.211 r=0.069 r=-0.089 r=0.109 P=0.059 P < 0.001 P < 0.001 P < 0.001 P=0.071 P=0.044 P=0.019 2.3 T2DM各种并发症的影响因素分析
通过Logistic回归分析建立未校正混杂因素的模型1, 校正混杂因素(性别、年龄、吸烟史、BMI、TC、TG、LDL-C、HDL-C、2 hPG、FPG、HbAlc)后建立模型2。回归分析结果显示,校正混杂因素后, RDW、CAR、UACR均是T2DM患者并发DR、DKD、DPN、CAD的影响因素(P < 0.05),见表 3。
表 3 T2DM各种并发症的影响因素分析并发症 指标 模型1 模型2 OR 95%CI P OR 95%CI P DR RDW 3.021 1.765~5.117 < 0.001 1.532 1.182~2.408 < 0.001 CAR 2.198 1.065~3.701 < 0.001 1.020 1.000~2.699 < 0.001 UACR 2.871 1.505~3.487 < 0.001 1.141 1.065~2.339 < 0.001 DKD RDW 2.333 1.298~5.111 < 0.001 1.295 1.185~2.301 < 0.001 CAR 2.574 1.358~4.098 < 0.001 1.302 1.041~2.805 < 0.001 UACR 2.625 1.482~4.926 < 0.001 1.365 1.095~2.619 < 0.001 DPN RDW 2.439 1.319~3.609 < 0.001 1.448 1.121~1.998 < 0.001 CAR 2.201 1.402~4.398 < 0.001 1.028 1.001~2.434 < 0.001 UACR 2.477 1.698~5.805 < 0.001 1.447 1.135~2.607 < 0.001 CAD RDW 2.905 1.174~3.051 < 0.001 1.669 1.280~3.131 < 0.001 CAR 2.174 1.202~4.339 < 0.001 1.587 1.117~2.453 < 0.001 UACR 2.598 1.498~4.480 < 0.001 1.312 1.094~2.824 < 0.001 2.4 RDW、CAR、UACR对T2DM并发症的预测效能
绘制RDW、CAR、UACR单用及联合应用诊断T2DM并发症的ROC曲线,见图 1, RDW、CAR、UACR单用及3项联合应用预测T2DM并发症的AUC值分别为0.753、0.858、0.885、0.915, 3项联合应用对T2DM并发症的预测效能更高(Z=3.221、2.605、2.334, P < 0.05)。
3. 讨论
T2DM是一种以慢性高血糖为特征的代谢性疾病,患者机体长期处于高血糖状态,容易引发大血管及微血管病变,影响患者身心健康[8]。T2MD并发症多为外周及自主神经系统损伤引起的临床综合征, DR、DKD、DPN、CAD是临床常见的几类糖尿病并发症, DR可导致糖尿病患者全视力缺陷甚至失明。研究[9]认为,亚临床炎症、代谢途径异常、氧化应激是DR的重要发生机制。DKD是常见的糖尿病并发症,研究[10-12]显示,机体内炎症因子均会损伤内皮细胞,影响肾小球通透性,进而引发DKD。高血糖是导致DPN的主要原因,但其确切发病机制尚未明确,普遍认为其是血管损伤、代谢紊乱、细胞因子异常、氧化应激等因素共同作用的结果。T2DM的发生与血脂异常密切相关,而高血糖、血脂异常均是动脉粥样硬化的影响因素。调查[13]显示, 70%的糖尿病患者会并发CAD, 且糖尿病患者的冠状动脉病变范围通常较非糖尿病患者更广,程度也更严重。
RDW是反映红细胞异质性的一项参数,数值越大表明红细胞形态差异越大,预示着机体可能发生了造血异常、贫血。RDW升高与红细胞稳态严重失衡密切相关,即红细胞生成-存活平衡发生异常,这可能与营养不良、血管炎症反应、氧化应激等因素有关。研究[14]指出,高血糖状态会弱化红细胞变性能力,缩短红细胞寿命,引起RDW升高。王云霞等[15]报道显示,RDW水平越高,T2DM患者的并发症发生风险越高,预后越差, RDW是预测糖尿病患者心血管死亡的敏感指标。CELIK A等[16]报道, RDW升高与T2MD患者并发CAD相关,截断值为13.25%时, RDW预测CAD的敏感度、特异度分别为62.9%和77.1%。本研究也显示, RDW是CAD的影响因素, RDW对CAD的影响比其他指标更为显著。
CRP为急性时相蛋白,机体在发生组织损伤或微生物入侵时,肝脏或脂肪组织会迅速合成CRP, 引起CRP浓度升高。血清ALB与炎症关系密切, ALB与CRP在炎症评估中呈负相关,两者均由肝脏细胞合成, CRP受到白细胞介素-6(IL-6)、肿瘤坏死因子-α(TNF-α)等细胞因子的正向调节,而高浓度IL-6、TNF-α是低蛋白血症的主要因素,由此可以解释CRP与ALB呈反向作用。CRP与ALB结合得出的新型炎症指标CAR能够从“致炎”与“抑炎”的相反作用上全面反映机体炎症状态,对炎症性疾病有更高的评估价值。目前, CAR已被广泛应用于呼吸系统疾病、恶性肿瘤、心脑血管疾病、肾病等病情的评估、预后预测、死亡险预测。国外有报道[17]指出,合并慢性疾病者的CAR水平与T2MD发病呈正相关,认为CAR对新发糖尿病有较高的预测能力。
研究[18]指出,24 h尿mALB对早期DKD的敏感性更高,即便是轻度的肾小球受损,也可检测到24 h尿mALB水平明显升高。对T2MD患者进行24 h尿mALB检测,可尽早发现早期肾功能损害。24 h尿mALB虽是早期诊断DKD的理想指标,但其存在标本收集不便、患者依从性差的缺陷,再加上24 h尿蛋白定量检测繁琐,大大降低了该指标的实用性。国外有学者[19]发现,糖尿病患者在尿总蛋白正常的情况下,尿白蛋白排泄水平偏高,据此认为尿mALB是肾损伤的早期预兆。由于尿微量白蛋白容易受到尿量、尿液浓缩等因素影响,而个体每日的UCr排出量相对恒定,所以临床常通过测定UCr对mALB进行校正,使用二者的比值UACR可有效避免尿量对检测结果的干扰。
本研究发现,有并发症的T2MD患者的RDW、CAR及UACR水平高于无并发症者。Logistic回归分析显示,RDW、CAR、UACR均是T2MD相关并发症(DR、DKD、DPN、CAD)的影响因素,进一步的ROC曲线分析显示, RDW、CAR、UACR 3项对T2MD并发症均有一定预测价值,并且3项联合应用对T2MD的预测效能更高,这与刘晶晶等[20]和蒋俏兰等[21]报道相符,这是因为RDW、CAR、UACR与炎症反应、肾损伤等糖尿病并发症的发生机制密切相关, 3项联合能够较为敏感地预测DR、DKD、DPN、CAD的发生。
综上所述,RDW、CAR、UACR水平升高与T2DM患者并发症的发生密切相关, 3项单独应用对T2DM并发症均有一定预测价值,但3项联合对T2DM并发症的预测效能更高,临床可通过动态监测RDW、CAR、UACR变化筛选出并发症高危患者,从而及时制订相关防治对策,改善患者预后。
-
表 1 2组患者生化指标水平比较(x±s)
指标 观察组(n=104) 对照组(n=104) FPG/(mmol/L) 7.20±1.27 7.16±2.03 2 hPG/(mmol/L) 12.41±1.70* 11.32±1.70 HbAlc/% 9.14±1.97* 7.43±0.29 总胆固醇/(mmol/L) 4.22±0.90* 3.67±0.84 甘油三酯/(mmol/L) 1.46±0.33* 1.28±0.35 HDL-C/(mmol/L) 1.25±0.50* 1.39±0.32 LDL-C/(mmol/L) 3.50±0.67* 3.12±0.54 WBC/(×109/L) 6.80±2.25 6.77±1.99 RDW/% 14.62±2.05* 12.51±2.37 CAR 0.19±0.08* 0.08±0.01 UACR 31.74±6.49* 14.42±1.33 FPG: 空腹血糖; WBC: 白细胞; 2 hPG: 餐后2 h血糖;
HbAlc: 糖化血红蛋白; LDL-C: 低密度脂蛋白胆固醇;
RDW: 红细胞分布宽度; CAR: C反应蛋白与白蛋白比值;
UACR: 尿微量白蛋白与尿肌酐比值;
HDL-C: 高密度脂蛋白胆固醇。
与对照组比较, * P < 0.05。表 2 RDW、CAR、UACR与血糖、血脂等指标的相关性
指标 FPG 2 hPG HbAlc TC TG HDL-C LDL-C RDW r=0.062 r=0.210 r=0.287 r=0.209 r=0.052 r=-0.092 r=0.101 P=0.061 P < 0.001 P < 0.001 P < 0.001 P=0.059 P=0.034 P=0.020 CAR r=0.072 r=0.209 r=0.301 r=0.198 r=0.072 r=-0.101 r=0.097 P=0.068 P < 0.001 P < 0.001 P < 0.001 P=0.077 P=0.020 P=0.030 UACR r=0.091 r=0.224 r=0.029 r=0.211 r=0.069 r=-0.089 r=0.109 P=0.059 P < 0.001 P < 0.001 P < 0.001 P=0.071 P=0.044 P=0.019 表 3 T2DM各种并发症的影响因素分析
并发症 指标 模型1 模型2 OR 95%CI P OR 95%CI P DR RDW 3.021 1.765~5.117 < 0.001 1.532 1.182~2.408 < 0.001 CAR 2.198 1.065~3.701 < 0.001 1.020 1.000~2.699 < 0.001 UACR 2.871 1.505~3.487 < 0.001 1.141 1.065~2.339 < 0.001 DKD RDW 2.333 1.298~5.111 < 0.001 1.295 1.185~2.301 < 0.001 CAR 2.574 1.358~4.098 < 0.001 1.302 1.041~2.805 < 0.001 UACR 2.625 1.482~4.926 < 0.001 1.365 1.095~2.619 < 0.001 DPN RDW 2.439 1.319~3.609 < 0.001 1.448 1.121~1.998 < 0.001 CAR 2.201 1.402~4.398 < 0.001 1.028 1.001~2.434 < 0.001 UACR 2.477 1.698~5.805 < 0.001 1.447 1.135~2.607 < 0.001 CAD RDW 2.905 1.174~3.051 < 0.001 1.669 1.280~3.131 < 0.001 CAR 2.174 1.202~4.339 < 0.001 1.587 1.117~2.453 < 0.001 UACR 2.598 1.498~4.480 < 0.001 1.312 1.094~2.824 < 0.001 -
[1] 季红运, 蒙连新, 吴娜, 等. 百色市老年糖尿病患者慢性并发症的患病现状及血糖控制情况分析[J]. 糖尿病新世界, 2022, 25(12): 190-194, 198. https://www.cnki.com.cn/Article/CJFDTOTAL-TNBX202212048.htm [2] 王中群. 重视糖尿病大血管并发症的发病、机制、评估与防治研究[J]. 中南医学科学杂志, 2022, 50(1): 1-6. https://www.cnki.com.cn/Article/CJFDTOTAL-HYYY202201001.htm [3] 李春惠, 程京, 彭爽, 等. 红细胞分布宽度与中性粒细胞/淋巴细胞比值对老年2型糖尿病病人不良预后的预测价值[J]. 实用老年医学, 2022, 36(7): 693-696, 701. doi: 10.3969/j.issn.1003-9198.2022.07.011 [4] 陈挺. 血清C反应蛋白与白蛋白比值在糖尿病酮症酸中毒合并感染中的诊断价值[J]. 中国乡村医药, 2022, 29(12): 75-76. https://www.cnki.com.cn/Article/CJFDTOTAL-XCYY202212038.htm [5] 王智峰, 李秋梅, 姜啸, 等. 2型糖尿病合并糖尿病肾病患者血清血管生成抑制蛋白1浓度及其与尿白蛋白肌酐比值的相关性分析[J]. 中国综合临床, 2022, 38(3): 268-273. [6] 中国老年型糖尿病防治临床指南编写组, 中国老年医学学会老年内分泌代谢分会, 中国老年保健医学研究会老年内分泌与代谢分会, 等. 中国老年2型糖尿病防治临床指南(2022年版)[J]. 中华内科杂志, 2022, 61(1): 12-50. https://www.cnki.com.cn/Article/CJFDTOTAL-HLSJ202309001.htm [7] 中华医学会糖尿病学分会. 中国2型糖尿病防治指南(十二): 糖尿病慢性并发症[J]. 中国社区医师, 2012, 28(6): 7. https://xuewen.cnki.net/CCND-YSBZ20230727B020.html [8] 周正平. 2型糖尿病患者体液免疫指标水平与血糖、胰岛素水平的相关性[J]. 实用临床医药杂志, 2019, 23(24): 74-76. doi: 10.7619/jcmp.201924023 [9] 张娴, 刘莉, 蔺以楼, 等. 炎性因子在糖尿病视网膜病变中的作用[J]. 河北医药, 2022, 44(14): 2203-2207, 2213. https://www.cnki.com.cn/Article/CJFDTOTAL-HBYZ202214029.htm [10] 张秀云, 侯凤英, 刘美, 等. 糖尿病肾病患者外周血lncRNA PACER表达与炎症反应及肾功能进展的关系[J]. 分子诊断与治疗杂志, 2022, 14(7): 1229-1232. https://www.cnki.com.cn/Article/CJFDTOTAL-YXYQ202207036.htm [11] 陈桐. 糖尿病和糖尿病肾病患者血清lncRNA GAS5/miR-21ceRNA调控网络的表达变化及意义[D]. 沈阳: 中国医科大学, 2017. [12] 张乃莹, 黎波. 2型糖尿病相关血清生物标志物检测分析[J]. 实用临床医药杂志, 2020, 24(21): 79-81. doi: 10.7619/jcmp.202021023 [13] 王娟, 许浩博, 张海鹏, 等. 合并2型糖尿病对冠心病患者冠状动脉非靶病变进展和血运重建的影响[J]. 中华心血管病杂志, 2020, 48(5): 393-400. [14] 林维, 冯奇桃, 刁晓梁, 等. 2型糖尿病合并冠心病患者的红细胞分布宽度的临床价值[J]. 临床与病理杂志, 2020, 40(9): 2281-2287. https://www.cnki.com.cn/Article/CJFDTOTAL-WYSB202009010.htm [15] 王云霞, 梁浩, 孙明玥, 等. 红细胞分布宽度在糖尿病及其并发症中的临床意义[J]. 中国糖尿病杂志, 2020, 28(8): 632-634. https://www.cnki.com.cn/Article/CJFDTOTAL-ZGTL202008017.htm [16] CELIK A, KARAYAKALI M, ALTUNKAS F, et al. Red cell distribution width is correlated with extensive coronary artery disease in patients with diabetes mellitus[J]. Cardiovasc J Afr, 2017, 28(5): 319-323.
[17] CHO A R, LEE S B, HONG K W, et al. C-reactive protein-to-albumin ratio and 8-year incidence of type 2 diabetes: the Korean genome and epidemiology study[J]. Acta Diabetol, 2021, 58(11): 1525-1532.
[18] 许高峰. 尿U-mALB、血清CysC、Hcy联合检测对糖尿病肾病的早期诊断价值[J]. 数理医药学杂志, 2020, 33(11): 1628-1630. https://www.cnki.com.cn/Article/CJFDTOTAL-SLYY202011021.htm [19] HAYASHI T, TOKURIKI S, OKUNO T, et al. Urinary podocalyxin as a possible novel marker of intrauterine nephrogenesis and extrauterine podocyte injury[J]. Pediatr Nephrol, 2017, 32(10): 1891-1896.
[20] 刘晶晶, 何红霞, 程珍. 2型糖尿病病人红细胞分布宽度的影响因素及其对心血管疾病的预测价值[J]. 中西医结合心脑血管病杂志, 2022, 20(9): 1640-1644. https://www.cnki.com.cn/Article/CJFDTOTAL-ZYYY202209022.htm [21] 蒋俏兰, 蒋兆定. C反应蛋白/白蛋白比值和尿白蛋白/肌酐比值与2型糖尿病并发症风险的相关性分析[J]. 中国糖尿病杂志, 2022, 30(7): 513-517. https://www.cnki.com.cn/Article/CJFDTOTAL-ZGTL202207007.htm -
期刊类型引用(2)
1. 胡勇,曾垂烨,刘正刚,龙世友,单俊源,李胜. 术前CAR和SGA与结直肠癌患者术后并发症的相关性分析. 医药前沿. 2024(12): 112-114 .  百度学术
百度学术
2. 王浩. 糖化血红蛋白检测对糖尿病并发症的预测价值. 中国医药指南. 2024(33): 25-27 .  百度学术
百度学术
其他类型引用(1)


 下载:
下载:

 苏公网安备 32100302010246号
