Predictive value of color Doppler ultrasound parameters for fetal growth restriction induced by gestational hypertension in high-altitude regions
-
摘要:目的
探讨彩色多普勒超声参数对高原地区妊娠高血压所致胎儿生长受限(FGR)的预测价值。
方法选取2020年7月—2022年6月于青海大学附属医院(海拔2 300米,按有无FGR分为A1组19例、A2组51例)、玉树州人民医院(海拔3 700米,按有无FGR分为B1组25例、B2组47例)和北京大学民航临床医学院(平原地区,对照组71例)就诊的妊娠高血压孕妇作为研究对象,各组孕妇均于妊娠28周接受胎儿彩色多普勒超声大脑中动脉(MCA)、脐动脉(UA)血流参数[搏动指数(PI)、阻力指数(RI)、收缩期峰值流速与舒张末期流速比值(S/D)、血流最高速度(PSV)]及脑-胎盘比(CPR)检测。采用多因素Logistic回归分析探讨妊娠高血压孕妇发生FGR的独立危险因素; 绘制受试者工作特征(ROC)曲线,分析彩色多普勒参数对妊娠高血压孕妇发生FGR的预测价值。
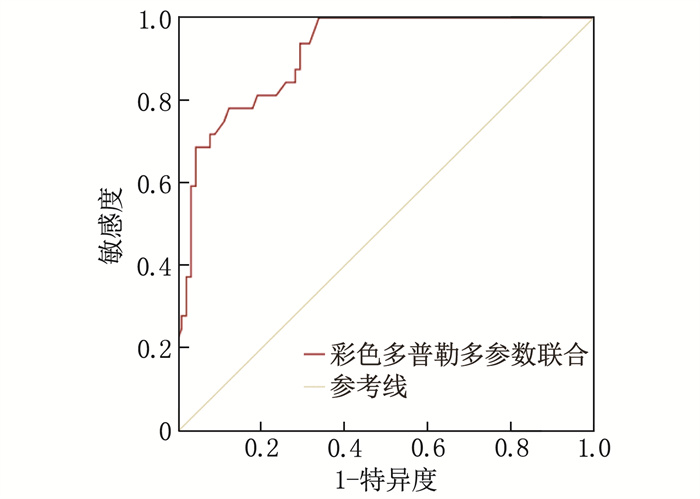
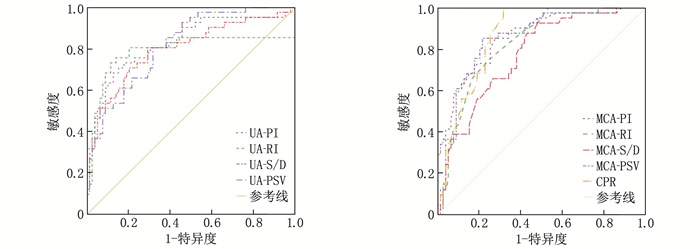
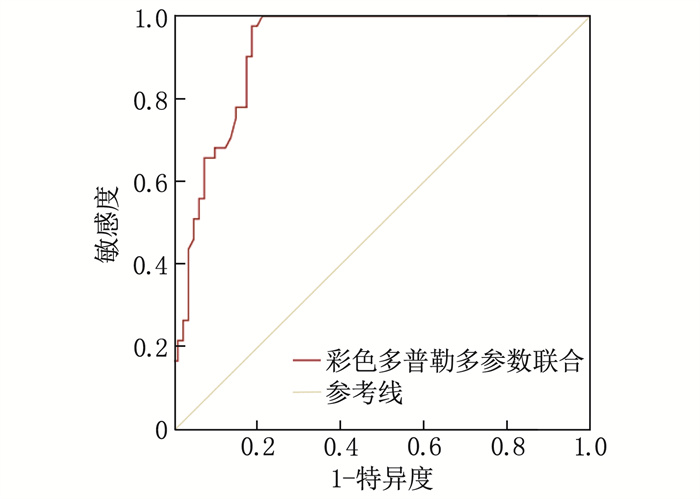
结果A1组、A2组、B1组、B2组孕妇胎儿的UA血流参数PI、RI、S/D、PSV均高于对照组, MCA血流参数PI、RI、S/D、PSV和CPR均低于对照组,差异有统计学意义(P < 0.05); 5组中, B1组的UA血流参数PI、RI、S/D、PSV最高, MCA血流参数PI、RI、S/D、PSV和CPR最低,差异有统计学意义(P < 0.05)。多因素Logistic回归分析结果显示,居住地海拔高、脐带异常均为妊娠高血压孕妇发生FGR的独立危险因素(P < 0.05)。ROC曲线分析结果显示,彩色多普勒多参数联合预测海拔2 300米和海拔3 700米高原地区妊娠高血压孕妇发生FGR的曲线下面积分别为0.906和0.917, 预测效能显著高于各参数单独预测(P < 0.05)。
结论孕中期彩色多普勒超声UA、MCA血流参数对不同海拔高原地区妊娠高血压所致FGR均具有较好的预测价值,且多参数联合检测的预测效能更高。
Abstract:ObjectiveTo investigate the predictive value of color Doppler ultrasound parameters for fetal growth restriction (FGR) induced by hypertensive disorders of pregnancy in high-altitude regions.
MethodsPregnant women with gestational hypertension who were treated between July 2020 and June 2022 at the Affiliated Hospital of Qinghai University (with altitude of 2, 300 meters, were divided into group A1 with 19 cases and group A2 with 51 cases according to occurrence of FGR), Yushu People's Hospital (with altitude of 3, 700 meters, were divided into group B1 with 25 cases and group B2 with 47 cases according to occurrence of FGR), and Civil Aviation Clinical Medical College of Peking University (plain region, control group with 71 cases) were enrolled in this study. All pregnant women in each group underwent fetal color Doppler ultrasound examination of the middle cerebral artery (MCA) and umbilical artery (UA) blood flow parameters, including pulsatility index (PI), resistance index (RI), systolic/diastolic ratio (S/D), peak systolicvelocity (PSV), and cerebroplacental ratio (CPR) at 28 weeks of gestation were detected. Multivariate Logistic regression analysis was performed to identify independent risk factors for FGR in pregnant women with gestational hypertension. Receiver operating characteristic (ROC) curves were plotted to analyze the predictive value of color Doppler parametersfor FGR.
ResultsThe UA blood flow parameters (PI, RI, S/D, PSV) of the fetuses in groups A1, A2, B1, and B2 were significantly higher than those in the control group, while the MCA blood flow parameters (PI, RI, S/D, PSV) and CPR were significantly lower (P < 0.05). Among the five groups, group B1 had the highest UA blood flow parameters (PI, RI, S/D, PSV) and the lowest MCA blood flow parameters (PI, RI, S/D, PSV) and CPR (P < 0.05). Multivariate Logistic regression analysis revealed that high altitude of residence and umbilical cord abnormalities were independent risk factors for FGR in pregnant women with gestational hypertension (P < 0.05). ROC curve analysis showed that the areas under the curves for the combined prediction of FGR in pregnant women with gestational hypertension at altitudes of 2, 300 meters and 3, 700 meters using color Doppler multi-parameters were 0.906 and 0.917, respectively, indicating a significantly higher predictive performance compared to individual parameter (P < 0.05).
ConclusionColor Doppler ultrasound parameters of UA and MCA bloodflow during the second trimester of pregnancy demonstrate good predictive value for FGR induced by hypertensive disorders of pregnancy in high-altitude regions at different altitudes, and the predictive performance is even higher when multiple parameters are combined.
-
-
表 1 各组妊娠高血压孕妇的一般资料比较(x±s)
组别 n 年龄/岁 孕周/周 产前体质量指数/(kg/m2) A1组 19 28.75±3.68 35.85±2.19 24.60±3.80 A2组 51 28.90±3.53 35.90±2.14 24.57±3.92 B1组 25 28.69±3.47 35.83±2.17 24.63±3.74 B2组 47 28.34±3.26 35.88±2.03 24.49±3.86 对照组 71 28.12±3.39 35.94±2.11 24.58±3.72 表 1 各组妊娠高血压孕妇的一般资料比较(x±s)
组别 n 年龄/岁 孕周/周 产前体质量指数/(kg/m2) A1组 19 28.75±3.68 35.85±2.19 24.60±3.80 A2组 51 28.90±3.53 35.90±2.14 24.57±3.92 B1组 25 28.69±3.47 35.83±2.17 24.63±3.74 B2组 47 28.34±3.26 35.88±2.03 24.49±3.86 对照组 71 28.12±3.39 35.94±2.11 24.58±3.72 表 2 5组孕妇胎儿彩色多普勒超声UA血流参数比较(x±s)
组别 n UA血流参数 PI RI S/D PSV/(cm/s) A1组 19 0.90±0.16* 0.62±0.05* 3.00±0.42* 42.81±8.15* A2组 51 0.72±0.11*# 0.49±0.07*# 2.38±0.32*# 40.05±7.60*# B1组 25 1.03±0.19*# 0.74±0.12*# 3.71±0.40*# 45.78±9.51*# B2组 47 0.76±0.13*△ 0.54±0.09*△ 2.86±0.32*△ 41.50±8.67*△ 对照组 71 0.62±0.08 0.33±0.04 1.94±0.16 38.52±7.15 UA: 脐动脉; PI: 搏动指数; RI: 阻力指数; S/D: 收缩期峰值流速与舒张末期流速比值; PSV: 血流最高速度。
与对照组比较, * P < 0.05; 与A1组比较, #P < 0.05; 与B1组比较, △P < 0.05。表 2 5组孕妇胎儿彩色多普勒超声UA血流参数比较(x±s)
组别 n UA血流参数 PI RI S/D PSV/(cm/s) A1组 19 0.90±0.16* 0.62±0.05* 3.00±0.42* 42.81±8.15* A2组 51 0.72±0.11*# 0.49±0.07*# 2.38±0.32*# 40.05±7.60*# B1组 25 1.03±0.19*# 0.74±0.12*# 3.71±0.40*# 45.78±9.51*# B2组 47 0.76±0.13*△ 0.54±0.09*△ 2.86±0.32*△ 41.50±8.67*△ 对照组 71 0.62±0.08 0.33±0.04 1.94±0.16 38.52±7.15 UA: 脐动脉; PI: 搏动指数; RI: 阻力指数; S/D: 收缩期峰值流速与舒张末期流速比值; PSV: 血流最高速度。
与对照组比较, * P < 0.05; 与A1组比较, #P < 0.05; 与B1组比较, △P < 0.05。表 3 5组孕妇胎儿彩色多普勒超声MCA血流参数和CPR比较(x±s)
组别 n MCA血流参数 CPR PI RI S/D PSV/(cm/s) A1组 19 1.44±0.13* 0.60±0.04* 4.05±0.72* 39.31±7.80* 1.52±0.37* A2组 51 1.73±0.25*# 0.73±0.07*# 4.49±0.93*# 45.43±8.75*# 1.85±0.53*# B1组 25 1.17±0.15*# 0.46±0.03*# 3.52±0.47*# 31.65±6.46*# 1.20±0.25*# B2组 47 1.60±0.18*△ 0.69±0.06*△ 4.16±0.55*△ 43.70±8.09*△ 1.62±0.42*△ 对照组 71 1.98±0.30 0.90±0.12 4.86±1.04 49.28±9.13 1.98±0.60 MCA: 大脑中动脉; CPR: 脑-胎盘比。与对照组比较, * P < 0.05; 与A1组比较, #P < 0.05; 与B1组比较, △P < 0.05。 表 3 5组孕妇胎儿彩色多普勒超声MCA血流参数和CPR比较(x±s)
组别 n MCA血流参数 CPR PI RI S/D PSV/(cm/s) A1组 19 1.44±0.13* 0.60±0.04* 4.05±0.72* 39.31±7.80* 1.52±0.37* A2组 51 1.73±0.25*# 0.73±0.07*# 4.49±0.93*# 45.43±8.75*# 1.85±0.53*# B1组 25 1.17±0.15*# 0.46±0.03*# 3.52±0.47*# 31.65±6.46*# 1.20±0.25*# B2组 47 1.60±0.18*△ 0.69±0.06*△ 4.16±0.55*△ 43.70±8.09*△ 1.62±0.42*△ 对照组 71 1.98±0.30 0.90±0.12 4.86±1.04 49.28±9.13 1.98±0.60 MCA: 大脑中动脉; CPR: 脑-胎盘比。与对照组比较, * P < 0.05; 与A1组比较, #P < 0.05; 与B1组比较, △P < 0.05。 表 4 妊娠高血压孕妇发生FGR的单因素分析(x±s)[n(%)]
因素 分类 FGR组(n=52) 非FGR组(n=161) t/χ2 P 基线资料 年龄/岁 29.81±3.41 27.98±3.12 3.594 < 0.001 产前体质量指数/(kg/m2) 24.68±3.62 24.54±3.77 0.235 0.814 孕周/周 35.92±2.08 35.89±2.36 0.082 0.935 孕次/次 3.02±0.16 2.98±0.14 1.728 0.085 产次/次 2.58±0.10 2.61±0.08 0.027 0.978 居住地海拔 高原地区 44(84.62) 98(60.87) 9.973 0.002 平原地区 8(15.38) 63(39.13) 羊水过少 有 10(19.23) 39(24.22) 0.553 0.457 无 42(80.77) 122(75.78) 脐带异常 有 19(36.54) 26(16.15) 9.806 0.002 无 33(63.46) 135(83.85) 实验室指标 空腹血糖/(mmol/L) 6.52±1.07 6.79±1.24 1.409 0.160 餐后2 h血糖/(mmol/L) 8.76±1.59 8.53±0.98 1.246 0.214 胰岛素抵抗指数 4.29±0.86 3.51±0.47 8.310 < 0.001 总胆固醇/(mmol/L) 5.14±0.93 5.07±0.72 0.566 0.572 高密度脂蛋白/(mmol/L) 1.32±0.26 1.24±0.31 1.679 0.095 低密度脂蛋白/(mmol/L) 2.58±0.61 2.64±0.78 0.507 0.613 表 4 妊娠高血压孕妇发生FGR的单因素分析(x±s)[n(%)]
因素 分类 FGR组(n=52) 非FGR组(n=161) t/χ2 P 基线资料 年龄/岁 29.81±3.41 27.98±3.12 3.594 < 0.001 产前体质量指数/(kg/m2) 24.68±3.62 24.54±3.77 0.235 0.814 孕周/周 35.92±2.08 35.89±2.36 0.082 0.935 孕次/次 3.02±0.16 2.98±0.14 1.728 0.085 产次/次 2.58±0.10 2.61±0.08 0.027 0.978 居住地海拔 高原地区 44(84.62) 98(60.87) 9.973 0.002 平原地区 8(15.38) 63(39.13) 羊水过少 有 10(19.23) 39(24.22) 0.553 0.457 无 42(80.77) 122(75.78) 脐带异常 有 19(36.54) 26(16.15) 9.806 0.002 无 33(63.46) 135(83.85) 实验室指标 空腹血糖/(mmol/L) 6.52±1.07 6.79±1.24 1.409 0.160 餐后2 h血糖/(mmol/L) 8.76±1.59 8.53±0.98 1.246 0.214 胰岛素抵抗指数 4.29±0.86 3.51±0.47 8.310 < 0.001 总胆固醇/(mmol/L) 5.14±0.93 5.07±0.72 0.566 0.572 高密度脂蛋白/(mmol/L) 1.32±0.26 1.24±0.31 1.679 0.095 低密度脂蛋白/(mmol/L) 2.58±0.61 2.64±0.78 0.507 0.613 表 5 妊娠高血压孕妇发生FGR的多因素Logistic回归分析
因素 β SE Wald χ2 OR 95%CI P 居住地海拔 0.894 0.423 4.467 2.445 1.067~5.602 0.350 脐带异常 1.029 0.511 4.405 2.798 1.028~7.618 0.045 表 5 妊娠高血压孕妇发生FGR的多因素Logistic回归分析
因素 β SE Wald χ2 OR 95%CI P 居住地海拔 0.894 0.423 4.467 2.445 1.067~5.602 0.350 脐带异常 1.029 0.511 4.405 2.798 1.028~7.618 0.045 表 6 彩色多普勒参数对海拔2 300米高原地区妊娠高血压孕妇发生FGR的预测效能
指标 AUC 标准误 敏感度/% 特异度/% 截断值 95%CI P UA PI 0.852 0.036 65.6 93.2 0.89 0.795~0.926 < 0.001 RI 0.706 0.075 71.9 95.5 0.52 0.637~0.802 < 0.001 S/D 0.742 0.051 78.1 67.0 3.01 0.674~0.841 < 0.001 PSV 0.779 0.045 59.4 83.0 44.16 cm/s 0.705~0.852 < 0.001 MCA PI 0.843 0.033 78.9 72.5 1.44 0.772~0.917 < 0.001 RI 0.831 0.042 73.7 82.4 0.62 0.756~0.891 < 0.001 S/D 0.775 0.043 73.7 64.3 4.10 0.690~0.844 < 0.001 PSV 0.832 0.040 68.4 88.2 36.71 cm/s 0.751~0.881 < 0.001 CPR 0.890 0.035 78.9 86.3 1.75 0.812~0.937 < 0.001 多参数联合 0.906 0.023 89.5 60.8 — 0.861~0.959 < 0.001 表 6 彩色多普勒参数对海拔2 300米高原地区妊娠高血压孕妇发生FGR的预测效能
指标 AUC 标准误 敏感度/% 特异度/% 截断值 95%CI P UA PI 0.852 0.036 65.6 93.2 0.89 0.795~0.926 < 0.001 RI 0.706 0.075 71.9 95.5 0.52 0.637~0.802 < 0.001 S/D 0.742 0.051 78.1 67.0 3.01 0.674~0.841 < 0.001 PSV 0.779 0.045 59.4 83.0 44.16 cm/s 0.705~0.852 < 0.001 MCA PI 0.843 0.033 78.9 72.5 1.44 0.772~0.917 < 0.001 RI 0.831 0.042 73.7 82.4 0.62 0.756~0.891 < 0.001 S/D 0.775 0.043 73.7 64.3 4.10 0.690~0.844 < 0.001 PSV 0.832 0.040 68.4 88.2 36.71 cm/s 0.751~0.881 < 0.001 CPR 0.890 0.035 78.9 86.3 1.75 0.812~0.937 < 0.001 多参数联合 0.906 0.023 89.5 60.8 — 0.861~0.959 < 0.001 表 7 彩色多普勒参数对海拔3 700米高原地区妊娠高血压孕妇发生FGR的预测效能
指标 AUC 标准误 敏感度/% 特异度/% 截断值 95%CI P UA PI 0.825 0.041 68.0 87.2 0.91 0.754~0.890 < 0.001 RI 0.761 0.062 72.0 83.0 0.66 0.682~0.831 < 0.001 S/D 0.803 0.049 80.0 74.5 3.08 0.712~0.863 < 0.001 PSV 0.846 0.035 80.0 72.3 46.72 cm/s 0.734~0.882 < 0.001 MCA PI 0.833 0.034 88.0 73.4 1.34 0.775~0.906 < 0.001 RI 0.837 0.035 92.0 63.8 0.65 0.751~0.894 < 0.001 S/D 0.820 0.038 92.0 61.7 3.73 0.749~0.872 < 0.001 PSV 0.856 0.031 88.0 72.3 39.22 cm/s 0.753~0.905 < 0.001 CPR 0.862 0.033 100.0 57.4 1.51 0.793~0.920 < 0.001 多参数联合 0.917 0.026 100.0 55.3 1.65 0.850~0.964 < 0.001 表 7 彩色多普勒参数对海拔3 700米高原地区妊娠高血压孕妇发生FGR的预测效能
指标 AUC 标准误 敏感度/% 特异度/% 截断值 95%CI P UA PI 0.825 0.041 68.0 87.2 0.91 0.754~0.890 < 0.001 RI 0.761 0.062 72.0 83.0 0.66 0.682~0.831 < 0.001 S/D 0.803 0.049 80.0 74.5 3.08 0.712~0.863 < 0.001 PSV 0.846 0.035 80.0 72.3 46.72 cm/s 0.734~0.882 < 0.001 MCA PI 0.833 0.034 88.0 73.4 1.34 0.775~0.906 < 0.001 RI 0.837 0.035 92.0 63.8 0.65 0.751~0.894 < 0.001 S/D 0.820 0.038 92.0 61.7 3.73 0.749~0.872 < 0.001 PSV 0.856 0.031 88.0 72.3 39.22 cm/s 0.753~0.905 < 0.001 CPR 0.862 0.033 100.0 57.4 1.51 0.793~0.920 < 0.001 多参数联合 0.917 0.026 100.0 55.3 1.65 0.850~0.964 < 0.001 -
[1] 中华医学会围产医学分会胎儿医学学组, 中华医学会妇产科学分会产科学组. 胎儿生长受限专家共识(2019版)[J]. 中国产前诊断杂志: 电子版, 2019, 11(4): 78-98. [2] BENDIX I, MILLER S L, WINTERHAGER E. Editorial: causes and consequences of intrauterine growth restriction[J]. Front Endocrinol, 2020, 11: 205. doi: 10.3389/fendo.2020.00205
[3] 黄巧玲, 王琳. 生长因子联合子宫动脉血流参数预测妊娠期高血压患者胎儿生长受限的价值[J]. 实用临床医药杂志, 2023, 27(16): 107-110. doi: 10.7619/jcmp.20231912 [4] 普布卓玛, 尼玛卓嘎, 普布德吉, 等. 低剂量阿司匹林对西藏高原地区子痫前期高、中危因素孕妇预防作用及妊娠结局的研究[J]. 临床医药文献电子杂志, 2021, 8(40): 1-4. [5] CIOBANU A, WRIGHT A, SYNGELAKI A, et al. Fetal Medicine Foundation reference ranges for umbilical artery and middle cerebral artery pulsatility index and cerebroplacental ratio[J]. Ultrasound Obstet Gynecol, 2019, 53(4): 465-472. doi: 10.1002/uog.20157
[6] 洪亚松. 孕晚期胎儿脐动脉与大脑中动脉血流参数对胎儿生长受限的预测价值[J]. 医疗装备, 2020, 33(20): 22-23. [7] 中华医学会妇产科学分会妊娠期高血压疾病学组. 妊娠期高血压疾病诊治指南(2015)[J]. 中华妇产科杂志, 2015, 50(10): 721-728. doi: 10.3760/cma.j.issn.0529-567x.2015.10.001 [8] 谢幸, 苟文丽. 妇产科学[M]. 8版. 北京: 人民卫生出版社, 2014: 64-142. [9] 施旭婷, 胥红斌. 妊娠期高血压疾病对高龄初产妇母婴结局的影响[J]. 实用临床医药杂志, 2020, 24(15): 93-95. doi: 10.7619/jcmp.202015026 [10] KESAVAN K, DEVASKAR S U. Intrauterine growth restriction: postnatal monitoring and outcomes[J]. Pediatr Clin North Am, 2019, 66(2): 403-423.
[11] SRIRAMBHATLA A, MITTAL S, VEDANTHAM H. Efficacy of pulsatility index of fetal vessels in predicting adverse perinatal outcomes in fetuses with growth restriction-differences in early- and late-onset fetal growth restriction[J]. Maedica, 2022, 17(1): 107-115.
[12] 姜雪, 陆瑞, 何笑. 不同孕龄超声脐动脉血流参数与胎儿窘迫的关系[J]. 中国医药导报, 2022, 19(21): 111-114. [13] 陈剑超, 周杰, 李晶. 胎儿肾动脉、大脑中动脉及静脉导管分流率检查对诊断妊高症患者胎儿宫内窘迫的临床价值[J]. 中南医学科学杂志, 2020, 48(1): 52-55. [14] LEWKOWITZ A K, TUULI M G, CAHILL A G, et al. Perinatal outcomes after intrauterine growth restriction and intermittently elevated umbilical artery Doppler[J]. Am J Obstet Gynecol MFM, 2019, 1(1): 64-73.
[15] WANG X J, LI L Y, YUAN P B, et al. Placental characteristics of selective intrauterine growth restriction with changing patterns in umbilical artery Doppler flow in monochorionic diamniotic twins[J]. J Perinat Med, 2022, 50(4): 433-437.
[16] 陈鲜霞, 张玉英, 罗冬梅, 等. 对高原缺氧环境下世居藏族和移居汉族胎儿脐动脉及大脑中动脉血流参数的研究[J]. 中国妇幼保健, 2021, 36(2): 318-324. [17] KRISHNAMURTHY M B, PHARANDE P, WHITELEY G, et al. Postnatal middle cerebral artery Dopplers in growth-restricted neonates[J]. Eur J Pediatr, 2020, 179(4): 571-577.
[18] YENER G, KAVAK S B, GUL Y, et al. Elabela levels in pregnancies with intrauterine growth retardation[J]. Ginekol Pol, 2023, 94(2): 113-118.
[19] DEVORE G R. Why does computation of centiles from equations for umbilical artery and middle cerebral artery pulsatility index and cerebroplacental ratio from Fetal Medicine Foundation study of 72 387 fetuses not agree with tabular results[J]. Ultrasound Obstet Gynecol, 2021, 57(2): 349-350.
-
期刊类型引用(53)
1. 张丽,张娜,刘新爱,王文娟,郝晶晶. 精神分裂症病人代谢综合征自我管理体验的质性研究. 全科护理. 2024(11): 2117-2121 .  百度学术
百度学术
2. 马芳珍,许国军. 基于奥瑞姆自理理论的健康教育在急性脑梗死卧床患者中的应用. 中国基层医药. 2023(01): 133-137 .  百度学术
百度学术
3. 樊建妮,兰燕,赵秀荣. 基于Orem自理理论的康复护理在脑梗死偏瘫患者中的应用效果. 临床医学研究与实践. 2023(08): 133-135 .  百度学术
百度学术
4. 叶娟,卢菁,王晶晶. 基于Orem理论的护理干预对胸外科术后患者自护能力、负面情绪的作用. 国际护理学杂志. 2023(18): 3319-3323 .  百度学术
百度学术
5. 胡东立. 基于Orem自理理论的康复护理对脑梗死恢复期患者认知功能及ADL能力的影响. 中国医学创新. 2022(04): 104-107 .  百度学术
百度学术
6. 冯敏,于辉,张艳. 递进式护理在老年股骨颈骨折术后患者中的应用效果. 临床医学研究与实践. 2022(10): 146-150 .  百度学术
百度学术
7. 薛东霞,李瑾. 基于全科理念Barthel指数评定量表的康复护理在年龄>60岁脑梗死后偏瘫患者中的应用. 临床研究. 2022(01): 164-167 .  百度学术
百度学术
8. 朱莹莹,兰曼丽. 基于Orem自理理论的康复训练联合奥塔戈运动对脑梗死偏瘫病人运动功能及治疗依从性的影响研究. 全科护理. 2022(32): 4465-4469 .  百度学术
百度学术
9. 周晓霞. 奥瑞姆自理模式对急性缺血性脑卒中患者自我护理能力及神经功能的影响. 中西医结合心血管病电子杂志. 2022(21): 136-138 .  百度学术
百度学术
10. 任春会,赵晓红. Orem自理模式在脑卒中患者护理效果及心理状态分析. 中外医疗. 2021(05): 151-153 .  百度学术
百度学术
11. 林虹,杨美,王小帆. 基于Orem自理理论康复护理联合情志干预对脑梗死偏瘫患者神经功能、自护能力及生活质量的影响. 国际护理学杂志. 2021(05): 891-894 .  百度学术
百度学术
12. 狄媛. 针刺联合康复训练治疗脑梗死后偏瘫对其脑血流动力学指标、神经缺损症状的影响. 现代养生. 2021(10): 40-43 .  百度学术
百度学术
13. 康宾宾. rTMS联合早期康复训练对脑梗死后偏瘫患者上肢功能恢复的影响. 医学理论与实践. 2021(11): 1963-1964 .  百度学术
百度学术
14. 张秀萍. Orem理论的分级延伸护理对髌骨粉碎性骨折的影响. 实用中西医结合临床. 2021(08): 145-147 .  百度学术
百度学术
15. 楚浓浓. 认知行为干预对脑梗后偏瘫患者肢体功能及生活质量的影响. 实用中西医结合临床. 2021(11): 154-155 .  百度学术
百度学术
16. 司秀荣. 阶段性语言训练在脑梗死运动性失语患者中的应用效果. 中国民康医学. 2021(12): 159-160 .  百度学术
百度学术
17. 许淑华,李敏,唐小冬. 跨理论模型结合动机性访谈对偏瘫患者康复自我效能研究. 中国当代医药. 2021(25): 52-55 .  百度学术
百度学术
18. 唐娟,崔金虹,尚芳芳,吴静,王璐. 强化社会、家庭支持对脑梗死伴抑郁患者心理及日常生活能力的影响. 国际精神病学杂志. 2020(01): 185-187 .  百度学术
百度学术
19. 张红利. 奥塔戈运动结合早期康复对脑梗死偏瘫患者FMA评分、下肢肌力及MFES评分的影响. 广东医学. 2020(05): 491-495 .  百度学术
百度学术
20. 李银侠,李培良,符小丽. 医护一体化护理对脑梗死患者自我效能及心理状态的影响. 内蒙古医学杂志. 2020(03): 348-349 .  百度学术
百度学术
21. 程丽丹. 认知行为干预联合健康信念对脑梗死后偏瘫患者康复的影响. 黑龙江医药. 2020(04): 955-957 .  百度学术
百度学术
22. 王秀英. 基于Orem自理理论的护理干预对放射性食管炎患者自理能力、并发症及生活质量的影响. 国际护理学杂志. 2020(12): 2255-2257 .  百度学术
百度学术
23. 许乐. Orem自理理论指导下路径式护理在急性脑梗死患者早期康复护理中的应用. 内蒙古医学杂志. 2020(11): 1359-1361 .  百度学术
百度学术
24. 吴小华. 以Orem自理理论为基础的康复护理对脑梗死偏瘫病人的干预效果研究. 全科护理. 2020(34): 4796-4798 .  百度学术
百度学术
25. 陈萍,王娜. 基于Orem理论护理对冠状动脉硬化性心脏病患者生活质量的影响. 临床医学研究与实践. 2019(01): 150-151 .  百度学术
百度学术
26. 黄国菊,崔岩,李军. Orem自理理论在妊娠合并乳腺癌患者护理中的应用效果. 保健医学研究与实践. 2019(01): 67-69 .  百度学术
百度学术
27. 吴妍平,王立新,孟莉,王云文,徐仁华. 延续性护理干预对老年脑梗死患者生活质量的影响. 滨州医学院学报. 2019(01): 66-68 .  百度学术
百度学术
28. 唐晶. 康复护理干预对脑梗死病人神经功能及日常生活能力的影响. 全科护理. 2019(08): 962-963 .  百度学术
百度学术
29. 谢静. 奥塔戈运动训练联合萧氏双C护理模式在老年脑梗死偏瘫患者中的应用效果研究. 中国全科医学. 2019(11): 1364-1368+1371 .  百度学术
百度学术
30. 李言亭. Orem自理理论护理对脑梗死患者心理状态及生活自理能力的影响. 中国民康医学. 2019(06): 155-157 .  百度学术
百度学术
31. 高燕美. 基于Orem理论为指导的延续性护理对老年帕金森病患者的影响. 护理实践与研究. 2019(09): 27-29 .  百度学术
百度学术
32. 毛美芹. Orem自护理论运用于缺血性脑卒中患者中的效果观察. 基层医学论坛. 2019(21): 2978-2980 .  百度学术
百度学术
33. 景俊. 奥塔戈运动联合奥瑞姆自理理论在脑梗死偏瘫患者中的应用. 中国民康医学. 2019(15): 167-169 .  百度学术
百度学术
34. 吴艳,崔静怡,孙爱荣,马贵君. 精神分裂症患者自我管理体验的质性研究. 中华现代护理杂志. 2019(23): 2952-2956 .  百度学术
百度学术
35. 张艳玲. 全程优质护理干预对脑梗死偏瘫患者ADL评分的影响. 河南医学研究. 2019(20): 3836-3838 .  百度学术
百度学术
36. 杨记意,刘君武. 基于Orem自理理论的护理干预对慢性胃炎患者自护能力及生活质量的影响. 护理实践与研究. 2019(19): 39-41 .  百度学术
百度学术
37. 邹艳辉,段红梅,陈芳,董晓燕. Orem自理理论的康复护理指导对脑梗死偏瘫患者日常自理能力和焦虑情绪的影响. 中外医学研究. 2019(30): 115-117 .  百度学术
百度学术
38. 杨伟宁,陈俊平. Orem自理康复护理模式在脑梗死偏瘫恢复期患者中的应用效果. 临床医学研究与实践. 2019(31): 148-150 .  百度学术
百度学术
39. 李亚利,王胜利. 森田疗法配合Orem自我护理干预对急性创伤骨折后抑郁患者预后的影响. 实用临床医药杂志. 2019(17): 123-126 .  本站查看
本站查看
40. 史优波,张微微,李宁宁,曹建平,何松彬. 太极“云手”运动结合Orem自理护理对脑卒中康复患者ADL的影响. 中国现代医生. 2019(29): 150-154 .  百度学术
百度学术
41. 谢桂兰,杨慧娟,邹琴娓,陈菁,王晓梅. 优质护理服务在老年性脑梗死患者中的应用效果. 中国当代医药. 2019(33): 219-222 .  百度学术
百度学术
42. 李芳. Orem自理模式护理对脑梗塞患者的护理效果探讨. 世界最新医学信息文摘. 2019(A2): 384-385 .  百度学术
百度学术
43. 梁艳芳. Orem自理理论对胃溃疡患者自护能力及心理状态的影响. 中国医药导报. 2018(10): 174-176+181 .  百度学术
百度学术
44. 梁宇. Orem自理护理模式对老年脑梗死患者认知功能及康复效果的影响. 中国医药指南. 2018(09): 231 .  百度学术
百度学术
45. 王香花. 早期功能训练对脑梗死偏瘫失语患者语言功能与运动功能的影响. 实用中医药杂志. 2018(06): 719-720 .  百度学术
百度学术
46. 王健. 奥伦自理模式对脑梗死患者康复锻炼的评价. 甘肃科技. 2018(16): 109-110 .  百度学术
百度学术
47. 林瑞珍. 早期康复护理模式应用于脑梗死患者的效果. 中国医药科学. 2018(18): 100-102 .  百度学术
百度学术
48. 曾凡林. Barthel指数分级指导下的Orem自理模式在脑卒中偏瘫患者中的应用. 护理实践与研究. 2018(18): 34-35 .  百度学术
百度学术
49. 邱敏玲,陈婷婷,许安有. 康复训练联合自理理论对脑卒中患者恢复效果观察. 中国卫生标准管理. 2018(23): 180-182 .  百度学术
百度学术
50. 张晓阳. 量化评估联合奥瑞姆理论在脑梗死后偏瘫患者中的应用. 河南医学研究. 2018(23): 4408-4409 .  百度学术
百度学术
51. 李海丽,张晓燕,王健. Orem自理理论应用于老年脑梗死患者的效果及对生活能力和认知功能的影响. 中医药临床杂志. 2018(09): 1748-1750 .  百度学术
百度学术
52. 鲁佳珏. 基于Orem理论的日间照料护理在慢性精神分裂症患者康复中的应用效果. 现代中西医结合杂志. 2017(33): 3752-3755 .  百度学术
百度学术
53. 段焱. 综合护理应用于脑梗死运动性失语患者中的疗效观察. 中国现代药物应用. 2017(24): 151-152 .  百度学术
百度学术
其他类型引用(3)


 下载:
下载:


 苏公网安备 32100302010246号
