| Citation: |
SHEN Yongzhi, HUANG Jiali, XIAN Kegong, LI Zhihui, ZHAO Fentu. Application of optical coherence tomography angiography in fundus screening in newly diagnosed patients with type 2 diabetes[J]. Journal of Clinical Medicine in Practice, 2023, 27(4): 56-60. DOI: 10.7619/jcmp.20222539

|
To explore the diagnostic value of optical coherence tomography angiography(OCTA) in fundus screening in newly diagnosed type 2 diabetic patients.
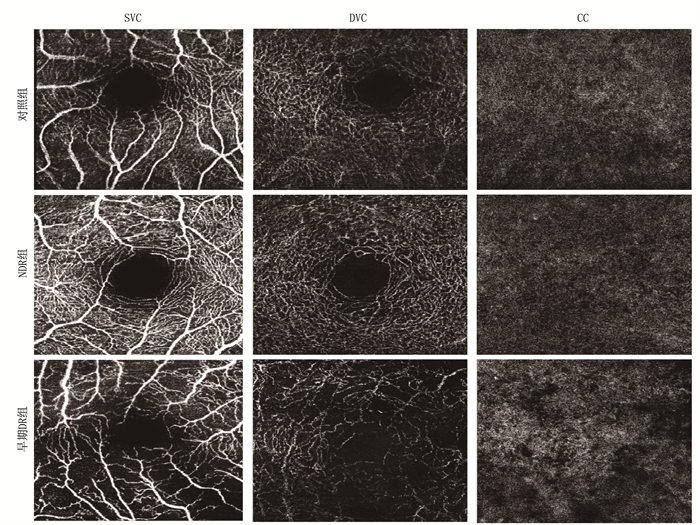
Forty patients with newly diagnosed type 2 diabetes from November 2019 to March 2021 were included in this study. Experienced physicians performed fundus examination for them. According to diabetic retinopathy (DR) conditions, non-DR patients were included in NDR group (n=20), those with mild non-proliferative diabetic retinopathy (NPDR) were included in early DR group (n=20). At the same time, 20 healthy subjects matched with age were included in control group. OCTA was used to scan and quantitatively analyze the macular region of the study subjects, and macular blood flow density(MVD) of superficial vascular capillary(SVC), deep vascular capillary (DVC) and choroidal capillaries layer (CC) and the area of the macular fovea without blood vessels (FAZ) were obtained. The difference of different indicators in each group and the value of screening and diagnosis for early DR were compared.
The blood flow density of SVC, DVC and CC were (0.52±0.09), (0.54±0.13) and (0.51±0.07), respectively in the NDR group, were (0.45±0.09), (0.43±0.09) and (0.45±0.06), respectively in the early DR group, and were (0.54±0.01), (0.57±0.01) and (0.52±0.02), respectively in the control group. Compared with the control group, blood flow density of SVC, DVC and CC decreased in the NDR group and early DR group. The FAZ area was (0.39±0.06) mm2 in the NDR group, (0.43±0.05) mm2 in the early DR group, and (0.29±0.01) mm2 in the control group. The FAZ area of the NDR group and the early DR group was larger than that of the control group, and the early DR group had the most obvious expansion of FAZ area. Multivariate Logistic analysis showed that DVC blood flow density and FAZ area both affected the diagnosis.
Early changes of macular vascular density and enlargement of FAZ can be observed in early diabetic retinopathy by OCTA. Patients with early diabetic retinopathy have reduced MVD and enlarged FAZ area. Both blood flow density and FAZ area of DVC can affect the diagnosis of early DR, and FAZ area has higher diagnostic value for early DR.
| [1] |
MAO W, YIP C W, CHEN W. Complications of diabetes in China: health system and economic implications[J]. BMC Public Health, 2019, 19(1): 269. doi: 10.1186/s12889-019-6569-8
|
| [2] |
SONG P, YU J, CHAN K Y, et al. Prevalence, risk factors and burden of diabetic retinopathy in China: a systematic review and meta-analysis[J]. J Glob Health, 2018, 8(1): 010803. doi: 10.7189/jogh.08.010803
|
| [3] |
DENG Y X, YE W Q, SUN Y T, et al. A meta-analysis of prevalence of diabetic retinopathy in China[J]. Zhonghua Yi Xue Za Zhi, 2020, 100(48): 3846-3852.
|
| [4] |
KASHIM R M, NEWTON P, OJO O. Diabetic retinopathy screening: a systematic review on patients' non-attendance[J]. Int J Environ Res Public Health, 2018, 15(1): E157. doi: 10.3390/ijerph15010157
|
| [5] |
CARNEVALI A, SACCONI R, CORBELLI E, et al. Optical coherence tomography angiography analysis of retinal vascular plexuses and choriocapillaris in patients with type 1 diabetes without diabetic retinopathy[J]. Acta Diabetol, 2017, 54(7): 695-702. doi: 10.1007/s00592-017-0996-8
|
| [6] |
LUPIDI M, COSCAS G, COSCAS F, et al. Retinal microvasculature in nonproliferative diabetic retinopathy: automated quantitative optical coherence tomography angiography assessment[J]. Ophthalmic Res, 2017, 58(3): 131-141. doi: 10.1159/000471885
|
| [7] |
TSAI A S H, GAN A T L, TING D S W, et al. DIABETIC MACULAR ISCHEMIA: correlation of retinal vasculature changes by optical coherence tomography angiography and functional deficit[J]. Retina, 2020, 40(11): 2184-2190. doi: 10.1097/IAE.0000000000002721
|
| [8] |
LI L, ALMANSOOB S, ZHANG P, et al. Quantitative analysis of retinal and choroid capillary ischaemia using optical coherence tomography angiography in type 2 diabetes[J]. Acta Ophthalmol, 2019, 97(3): 240-246. doi: 10.1111/aos.14076
|
| [9] |
张占荣, 臧冬晓, 刘华, 等. 采用OCTA分析非增殖期糖尿病视网膜病变患者黄斑区血流密度[J]. 国际眼科杂志, 2020, 20(10): 1780-1785. https://www.cnki.com.cn/Article/CJFDTOTAL-GJYK202010029.htm
|
| [10] |
UM T, SEO E J, KIM Y J, et al. Optical coherence tomography angiography findings of type 1 diabetic patients with diabetic retinopathy, in comparison with type 2 patients[J]. Graefes Arch Clin Exp Ophthalmol, 2020, 258(2): 281-288. doi: 10.1007/s00417-019-04517-6
|
| [11] |
GUO Y, LIU S, XU H. Uric acid and diabetic retinopathy: a systematic review and meta-analysis[J]. Front Public Health, 2022, 10: 906760.
|
© 2020 《实用临床医药杂志》编辑部
Address: 江苏省扬州市江阳中路136号,扬州大学江阳路北校区14号楼201室China Pos: 225009Tel: 0514-87978917、87978989、87978807
Supported by:
Beijing Renhe Information Technology Co., Ltd.

 苏公网安备 32100302010246号
 DownLoad: